TAKEAWAYS - Our analysis of KIPO's 2022 IP statistics report on secondary battery patents shows some interesting differences in patent filing trends at KIPO, JPO and CNIPA, as summarized below:
| KIPO | Patents concentrated among a few large companies, and openness to foreign applicants |
| JPO | Largest number of filings, but technology development level reaching Maturity or Decay stage |
| CNIPA | Rapid growth in patent filings, but distributed across numerous applicants |
To efficiently construct a global patent portfolio, particularly covering Asian patents, significant attention should be paid to these differences when deciding on patent filing strategies.
The Korean Intellectual Property Office (KIPO) recently issued its 2022 IP statistics report covering four major components of secondary batteries (cathodes, anodes, separators and electrolytes). The report analyzed 352,965 patent applications filed in the big 5 patent offices (KIPO, USPTO, JPO, EPO and CNIPA) from 2000 to 2021 according to keywords and IPC/CPC combinations.
Table 1. Patent applications filed in the big 5 IP jurisdictions
| Patent office | Cathode | Anode | Separator | Electrolyte | Total | |
| No. of patent applications filed (2000-2021) |
KIPO | 14,199 | 12,097 | 7,014 | 13,017 | 46,327 |
| USPTO | 21,271 | 19,178 | 9,597 | 20,380 | 70,426 | |
| JPO | 37,287 | 37,689 | 11,595 | 34,133 | 120,704 | |
| EPO | 9,960 | 9,222 | 4,568 | 8,996 | 32,746 | |
| CNIPA | 32,846 | 17,161 | 11,445 | 21,310 | 82,762 | |
| Sum | 115,563 | 95,347 | 44,219 | 97,836 | 352,965 |
By applicant nationality, the largest share of applicants was from Japan, followed by Korea and China, and then the United States and Europe.
Table 2. Patent applications filed according to applicant nationality
| Applicant Nationality | Cathode | Anode | Separator | Electrolyte | Sum | |
| No. of patent applications filed (2000-2021) | KR | 16,077 | 13,904 | 8,526 | 14,652 | 53,159 |
| US | 10,460 | 9,848 | 5,977 | 10,347 | 36,632 | |
| JP | 59,089 | 56,659 | 19,562 | 53,902 | 189,212 | |
| EP | 6,809 | 6,381 | 3,177 | 6,621 | 22,988 | |
| CN | 21,172 | 6,650 | 6,285 | 10,459 | 44,566 |
However, the report also breaks down the numbers of applicants and applications filed at each patent office in each technical field for successive five-year intervals from 2000 to 2019, which yields some additional insights. In terms of lithium-ion battery industry development, based on patent filings, Japan seems to have dominated the period from 2000-2004 (1st period), while Korea began to enter the market in the period from 2005-2009 (2nd period). Korea overtook Japan in the period from 2010-2014 (3rd period), which is also when China entered the market, and China became a major player in the period from 2015-2019 (4th period).
Using patent indicators organized according to a technology life cycle (TLC) S-curve analysis1 as summarized in the table below, we can broadly evaluate the level of technology development of the four major components of lithium ion batteries reflected in the big 5 patent offices.
Table 3. Patent trends in terms of TLC level
| TLC level | Technology Status | Number of Applications | Number of Applicants |
| R&D phase | new technology emerges | Low but slowly increasing | Small (pioneers only) |
| Ascent phase | massive R&D and increased competition | Rapid increase | Rapid increase (newly entered competitors) |
| Maturity phase | steady R&D and some competitors are eliminated | Steady | Steady or decrease (some abandon/withdraw business) |
| Decay phase | replacement technology emerges | Decrease | Decrease (survivors only) |
In our analysis, we have used some additional indicators such as (i) the change rate (%) in the number of patent applications, (ii) the change rate (%) in the number of applicants, and (iii) the average number of patent applications per applicant over each period for the four major components, in addition to the commonly used (iv) number of applications, (v) number of applicants, and (vi) applicant types. From this, we can see some interesting stories behind these simple filing statistics.
JPO: The patent office with the most filings, but technology development level reaching Maturity or Decay
As a representative example, we discuss electrolyte patents below. As expected, the largest number of patent applications have been filed at the JPO over the 3rd and 4th periods (see the red circle in Fig. 1). However, from 2010 to 2019 (the 3rd and 4th periods), the overall number of patent applications worldwide also dramatically increased (see the red box in Fig. 2).
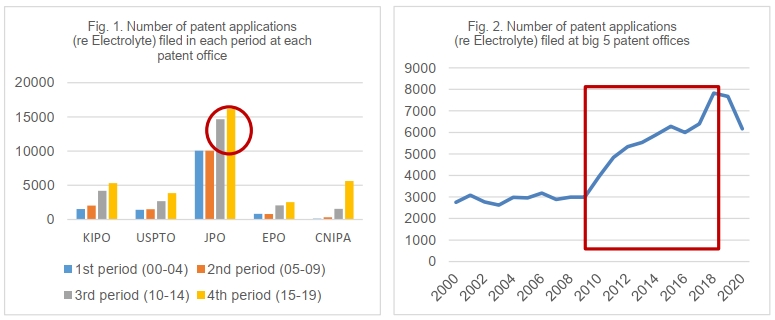
Thus, the increase in patent applications at the JPO in the 3rd and 4th periods may simply reflect global trends, and not necessarily factors specific to the JPO. To confirm, we conducted an additional analysis using the additional indicators described above (e.g., the change rate (%) in the number of patent applications/applicants in one period over the previous period).
These numbers indicate that the rate of change in patent applications filed at the JPO actually has been the lowest of the major 5 patent offices (see the red circle in Fig. 3), even over the 3rd and 4th periods when overall worldwide rate of increase was very high (see the red box in Fig. 2 above). This suggests that the apparent trends in Fig. 1 are actually quite opposite to reality. The rates of change of applicant numbers show a similar trend. In contrast, the rate of change of patent applications/applicants filed at the CNIPA is the highest in every period (see the green boxes in Figs. 3 and 4), and the total patent filings at the CNIPA rank 2nd out of the big 5 patent offices, slightly higher than the USPTO in 3rd. (see Table 1 above).
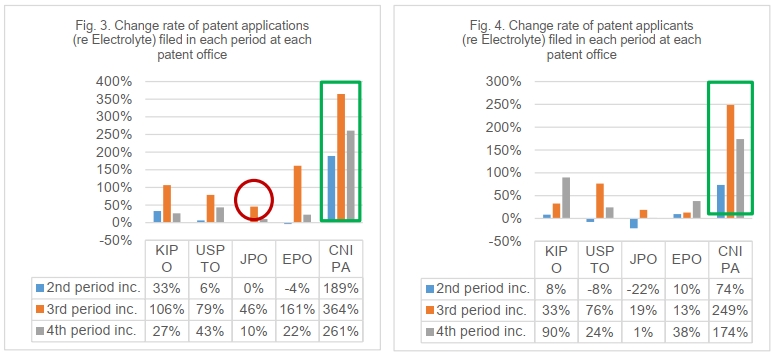
Matching these results with the TLC phases explained earlier (see Table 3), it would appear that Japan entered the decay phase from the 2nd period, while China entered the ascent phase from the 3th period. This suggests that Japanese applications in the electrolyte field will gradually decrease in the future, while applications in China should continue to increase rapidly. The other battery component technology areas show similar trends. Thus, regardless of the large total filing numbers currently at the JPO, if the technology development level at the JPO indicates Maturity or Decay phases of the TLC curve, patent filings at the JPO are likely to level off or even decrease in the near future, while the other major patent offices (KIPO, USPTO, EPO and CNIPA) show relatively more activity and reflect an earlier stage of technology development.
CNIPA: Rapid growth in patent filings, but distributed across numerous applicants
While application filings at CNIPA are rapidly increasing, interestingly, the number of applications per applicant shows a relatively small increase compared to other patent offices (see the green box in Fig. 5).
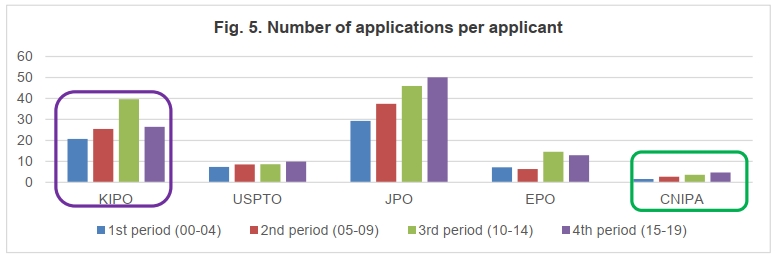
This may be a reflection of the ratio of types of applicants involved (company, government, university, and individual applicants). Universities and individuals represent a much larger share of CNIPA filings (university 21.2%, individual 3.9%) compared to patent offices in other countries (typically university 5%-10%, and individual 1% or less). In particular, the opposite trend is reflected in the numbers at KIPO and the JPO, wherein the share of company filers is relatively large, and mostly reflects a few large companies with large patent portfolios, while battery patents in China seem to be dispersed among numerous applicants and not concentrated among a few large companies.
KIPO: Patents concentrated with a few large companies, and openness to foreign applicants
As noted above, the patent filing situation in KIPO is quite different from China. The high average number of patent filings per applicant (see the violet box in Fig. 5) reflects that a much larger share of patents in Korea is owned by companies (over 90%), with a few large companies representing the bulk of those filings. Large-scale patent disputes in the battery field have been ongoing in Korea in recent years, so because a sufficiently strong patent portfolio is needed to compete against large company portfolios in Korea, large Korean companies have tended to be more favorably positioned in such disputes. In other words, this concentration of patents has tended to be a powerful weapon for large Korean companies, who have gained extensive experience in patent disputes in battery field and are quite aggressive. Given the leading position of Korean cell makers in the lithium ion battery market, and the fact that many Chinese battery component/material makers have established production facilities in Korea due to the requirements of the US IRA (Inflation Reduction Act), strong patent portfolios in Korea are likely to become even more important.
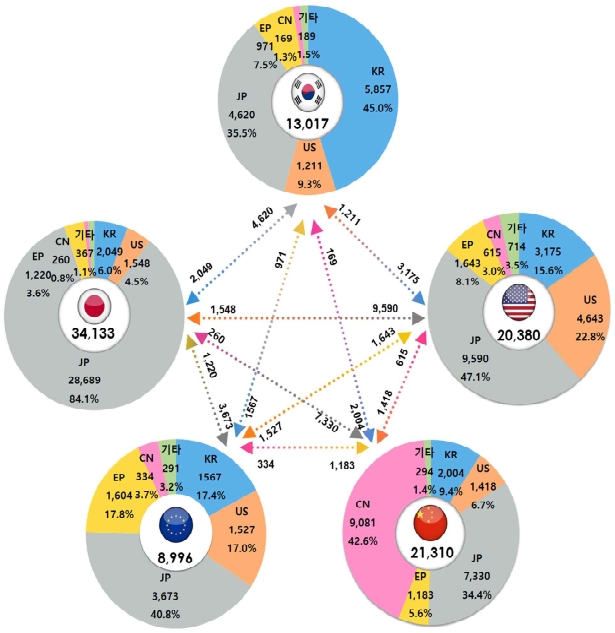
The KIPO report also provides information on the number of outgoing and incoming applications between the IP 5 patent offices, from which the foreign filing tendencies in each country can be extrapolated. Japan seems to be the most common origin of overseas applications filed in the major patent offices, with Korean applicants also representing a significant share of overseas applications, while in contrast Chinese applicants seem to focus on filing mainly domestic applications. On the other hand, the ratio of foreign to domestic filings at the JPO is very low, which suggests that Japan may not be an easy market for foreign lithium ion battery companies. A much higher percentage of filings at KIPO are foreign, indicating Korea may be relatively more open to foreign applicants (see Fig. 6).
Fig. 6. Number of outgoing/incoming applications between IP big 5 patent offices
As the above patent analysis shows, while Korea, Japan, and China are leaders in the secondary battery industry as well as in patent filings on secondary battery technology, the detailed patent environment of each of these countries is quite different. Entities seeking to construct a global patent portfolio, particularly covering Asian patents, are well-advised to pay attention to these differences when deciding their patent filing strategies.
1 Research Policy, Volume 22, Issue 4, August 1993, Pages 279-308 and Research Policy, Volume 36, Issue 3, April 2007, Pages 387-398
Related Topics